



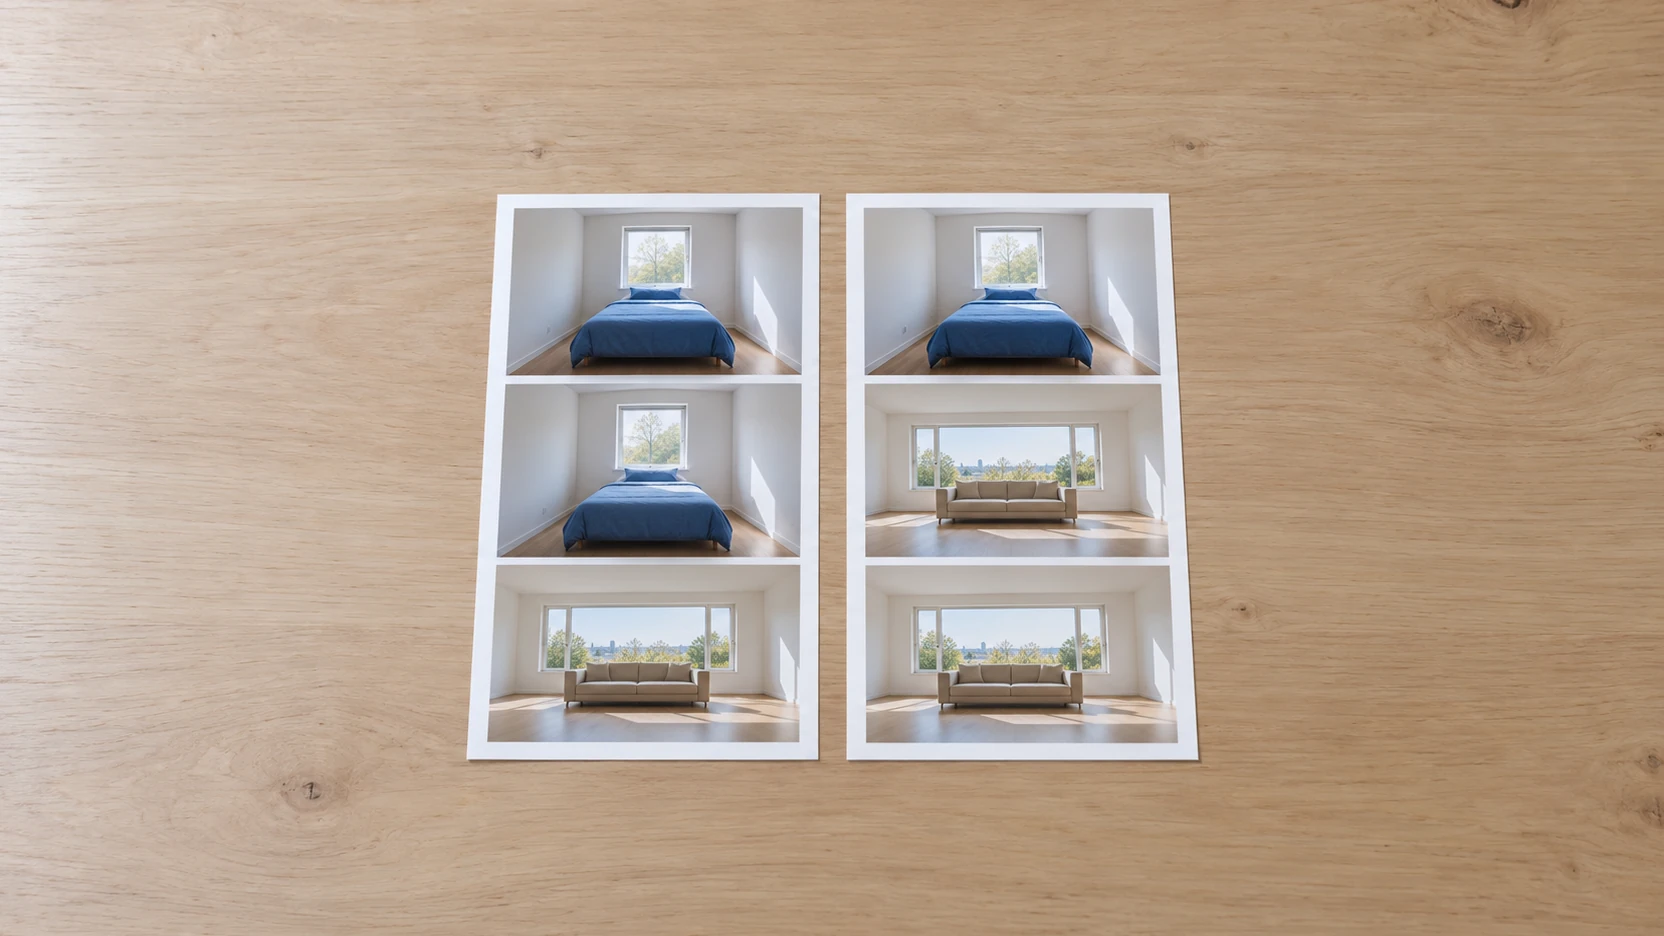
A separate overview shows a noticeably higher average asking price in the second month. The obvious explanation is: all properties have become more expensive. That need not be true. Perhaps the second selection simply contains more large or differently equipped units. A small made-up numerical example helps to understand this possibility before a change in a table becomes a market report.
Name the counted price first
For our example we use the total advertised purchase price per apartment. We explicitly do not calculate euros per square metre, actually notarised prices or the value of a specific property. This specification is important: a different price concept would produce a different calculation.
The figures are entirely fictitious and do not describe any German location. There are two groups: smaller apartments each with an asking price of 200.000 Euro and larger apartments each with 400.000 Euro. Within these simplified groups the price remains unchanged in both observations. This equality is also only an assumption for the explanation.
Two selections with different proportions
In the first selection there are nine smaller apartments and one larger. The summed prices amount to 2.200.000 Euro. Divided by ten this gives 220.000 Euro per advertised unit.
In the second selection there is one smaller and nine larger apartments. The total is 3.800.000 Euro; the average is 380.000 Euro. The mean therefore rises even though no apartment in its respective group was priced higher. The composition has changed. From this one must not conclude that every comparable property experienced a corresponding increase in value.
Another indicator does not automatically solve every problem
The median can also jump when the composition changes. In the example the middle position of the first selection lies in the cheaper group, that of the second in the more expensive group. A switch from the mean to the median therefore does not prevent every misinterpretation. Which indicator is suitable for a question depends on definition, selection and data basis.
Similarly, a price per square metre would not be a panacea against all quality differences. Location, condition, size and other features can still play a role. Our editorial recommendation is: first compare groups that are as comparable as possible and name remaining differences, rather than calling a convenient indicator fully adjusted.
An average of listings is not an official house price index
Destatis describes the house price index based on certain transactions of residential properties. [HPI] The methodological explanation also addresses the statistical consideration of value-determining characteristics. [HPI-METHOD] The official index is therefore not simply the average of any arbitrary list of visible offers.
The directly quoted methodological explanation describes the historical revision of 2019. It only shows here that price-determining characteristics are taken into account statistically; it does not therefore check all current model parameters. The article does not adopt current index levels or any specific regression calculation. It uses its own arithmetic only to explain the reason why a changed selection can alter a raw indicator.
Label a price overview so that its limits remain visible
Note source, observation time, area, price type, sample size and selection rules. Check whether duplicate listings or newly added types of properties influence the comparison. If you only have a small own sample, state that as well. It does not become representative simply because it appears in a professional graphic.
An appropriate summary could read: “In our selection the average advertised total price rose; at the same time the share of larger apartments changed.” That separates observation and explanation. For a market or investment decision additional appropriate information must be added. The numerical example promises neither an achievable sale price nor a future development.